SLoCaT Analysis of 150 Transport Emission Methodologies and Tools Shows Strong Potential to Measure Carbon Reduction and Other Benefits
Measuring CO2 in transport projects and programs is essential to driving further action on transport and climate change, through quantification of the potential contribution of low carbon transport infrastructure and services in comparison to more carbon-intensive investments. Since it can be difficult to quantify positive impacts from complex transport systems in comparison to fixed energy infrastructure, the sustainable transport sector has traditionally received less attention than other sectors from sources of climate finance.
To take stock of available methodologies, the SLoCaT Partnership has compiled a detailed qualitative assessment of 150 transport greenhouse gas (GHG) emission methodologies and tools, which cover a range of transport subsectors and include both passenger and freight methodologies. The number of methodologies, as well as their scope indicate that action on transport and climate change is not held back by the absence of tools to analyze transport interventions for their climate impact.
GHG Methodologies
1. GHG emission methodology development is an ongoing process, with new methodologies being added each year. Figure 1 shows the development of GHG methodologies for transport by release year, which demonstrates a marked increase in methodologies since 2007.
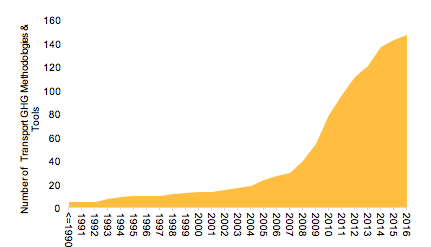
Figure 1 Transport GHG Emission Methodologies and Tools Development from 1990
The SLoCaT analysis demonstrates that GHG methodologies developed to date cover all major transport subsectors to facilitate the provision of needed sustainable transport infrastructure and services. While close to 89% of methodologies reviewed to date are related to the roadway sector, a significant percentage of methodologies consider other modes including railways (50%), waterways (39%) and aviation (31%).
Within the road sector, non-motorized transport modes such as walking and cycling are relatively neglected in the methodologies and tools, with about 21% share and with other modes with a more evenly distributed share (between 41% and 65%) (Figure 2).
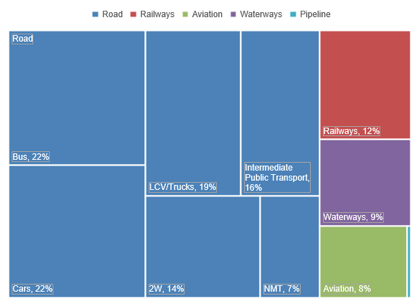
Figure 2 Type of Modes Considered in GHG emission Methodologies and Tools
2. There is a growing body of freight-related methodologies, with about 69% of methodologies applicable to the freight sector, and about 96% of waterway methodologies oriented toward freight, due to the rapid growth of freight shipping activity.
3. The analysis shows that about 38% of methodologies and tools consider lifecycle emissions. About 34% of infrastructure related methodologies account for construction emissions as part of a total footprint analysis, which may be equivalent to a range from several months to up to 30 years of operating emissions, depending on facility type.
4. The primary function of the tools and methodologies is to analyse the impact of transport emission strategies specifically (50%), with only about 25% of tools and methodologies focusing on GHG inventories or projections for all economic sectors (where transport is a subsector), and only about 23% focusing solely on transport sources with the objective to develop emission factors or carry out comprehensive emission inventories for all gases emitted during vehicle use for the base year.
5. Three quarters of tools and methodologies are financed by development agencies and governments. NGOs and academia have financed nearly 27% of these tools, while the private sector has contributed to the development of only 8% of tools and methodologies, of which 90% are primarily freight-oriented (Figure 3).
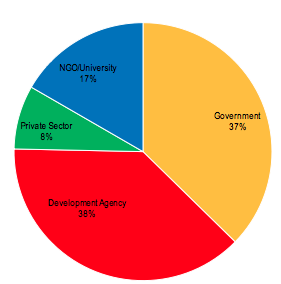
Figure 3 Stakeholder Financing Tool/Methodology Development
6. While about 59% of methodologies and tools reviewed allow for a multi-year analysis period, about 42% of methodologies limit analysis to a single year. It is crucial to consider longer term impacts, since almost all transport investments require several years to yield positive impacts, a timeframe well within a project’s useful life.
7. Methodologies and tools considered in the review are fairly evenly distributed among different application areas, with the exception of supply chain emission quantification, which constitutes only an 8% share (Figure 4).
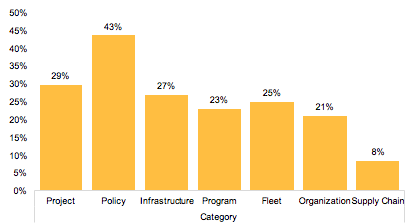
Figure 4 Typology of Methodology and Tool
8. While the majority of methodologies tend to be detailed in character and data requirements, there are also a growing number of sketch tools (representing about 18% of methodologies) that provide order-of-magnitude emissions estimates where data is scarce. These sketch models are extremely useful in developing countries where data availability and institutional capacity are generally low.
9. A recent SLoCaT analysis[1] reveals that only 62 out of 138 countries surveyed[2] had carried out detailed bottom-up emission projections. This review reveals that out of 150 methodologies and tools, 99% are useful for bottom-up modeling, with 41% of these tools useful for national level quantification, and 51% of these tools available free of charge. This suggests potential for greater leverage of sketch analysis tools for application in countries that lack adequate data and institutional capacity. The methodologies cover a broad range of different mitigation action types in terms of type of intervention.
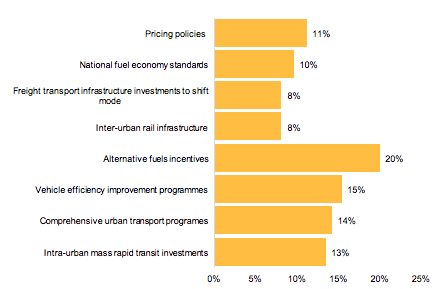
Figure 5 Type of Mitigation Action
10. While each of the methodologies examined was developed with the primary goal of measuring CO2 emissions, roughly 56% of methodologies can also be used to assess other benefits of proposed measures. This is an important contribution, as application of co-benefits to climate finance-supported transport sector projects has been limited to date.
11. SLoCaT’s analysis indicates that nearly 41% of GHG methodologies also quantify air pollutants such as particulate matter (PM) and nitrous oxides (NOx). Only about 7% of these methodologies quantify short-lived climate pollutants (SLCPs) like methane and black carbon, which can be critical factors in shifting the balance of a transport investments from infeasible to feasible. Additional co-benefits captured in the methodologies include fuel savings (27%), road safety impacts (9%) and travel time savings (5%), as shown in Figure 6.
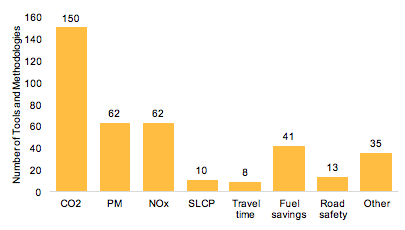
Figure 6 Co-benefits in Transport GHG Emission Methodologies and Tools
Conclusions
In summary, this initial analysis of GHG methodologies demonstrates that there is an increasingly broad range of tools to support the analysis of transport interventions for potential climate impact and other social impacts. The rapid growth in methodologies since 2007 suggests that the drive for more options to quantify CO2 reductions has in turn produced a wider set of tools to measure development co-benefits. The analysis has yielded the following initial recommendations for further development of GHG methodologies.
First, is noted that the majority of methodologies are project–based, which runs counter to the current trend toward more programmatic approaches (e.g. as incorporated in an increasing number of Nationally Appropriate Mitigation Actions (NAMAs)) and toward more sector-wide approaches (e.g. as mandated in the development of Intended Nationally Determined Contributions (INDCs)) to GHG mitigation strategies. Second, it is noted that there are relatively few methodologies to quantify impacts of transport demand management, non-motorized transport, and urban freight, which are essential pieces of a comprehensive portfolio of sustainable transport infrastructure and services.
Third, it is important for methodologies to allow ‘business-as-usual’ project baselines (as included in 84% of methodologies assessed), which reflect likely investment trajectories based on past investments and current policy frameworks (as opposed to simple ‘no action’ scenarios), so that sound transport investments can be advanced and unsound investments can be avoided. Fourth, while about 59% of methodologies reviewed (e.g. city level inventories, fleet level assessments, freight supply chains) consider an analysis period of more than one year, still 42% of methodologies that limit analysis to a single year and only 38% of methodologies allow full life-cycle analyses. It is crucial to consider longer term impacts, since almost all transport projects may require several decades to yield positive impacts, a timeframe well within the useful life of most projects.
Fifth, the vast majority of methodologies and tools reviewed are useful for bottom-up modeling, with roughly half useful for national level quantification and available free of charge, suggesting potential for greater low-cost technical assistance in countries lacking adequate transport data and needed capacity.
Finally, it is important that co-benefits be increasingly prioritized in decision-making processes for transport policies, and thus it is essential that the growing trend toward incorporating co-benefits into GHG methodologies be even more far-reaching. A broader incorporation of social co-benefits (including air quality and road safety improvements, and travel time and fuel savings) into GHG emission methodologies offers the potential to improve the cost-benefit ratios of sustainable transport investments, and to better reflect the contribution of such investments toward a range of sustainable development goals in the short, medium, and long term.
It is hoped that this broad characterization of existing methodologies can help to drive progress toward an even more robust set of tools to more effectively portray the potential contribution of sustainable transport projects in the future. The SLoCaT Partnership invites any input on additional methodologies, or revisions to existing methodologies.
Note: The SLoCaT Transport GHG Emissions Methodologies Database is a work in progress and the data shown may contain errors or omissions and cannot be considered exhaustive. The SLoCaT Partnership is appealing to relevant organizations to provide comments and additions to the database making use of the provided worksheets. Please contact Karl Peet (karl.peet@slocatpartnership.org) for any revisions or further input.
[1] Emission Reduction Potential in the Transport Sector by 2030
[2] As of November 2015, 138 countries worldwide had developed INDC economy-wide targets.