
[vc_row][vc_column][vc_column_text]The TCC-GSR will be a data-driven report reflecting the current status of transport. The report will contain quantitative and qualitative data from many sources, including formal data and quality peer-reviewed informal data. Outputs will focus on global and regional data (e.g. transport emission trends), national data (e.g. transport mitigation potential studies), and supportive policies and standards (e.g. fuel economy targets).
The TCC-GSR will include dashboards with indicators representing principle transport and climate change trends. Data will be presented through charts, infographics, maps, and supplementary reference tables.
Firstly, the TCC-GSR will illustrate global trends in transport demand that drive climate change, to demonstrate that climate change mitigation efforts cannot succeed without decarbonisation of transport. For example, here you can see how population, urban population and economic growth drive the increase in transport energy consumption, oil consumption and transport CO2 emissions from 2000 to 2017.
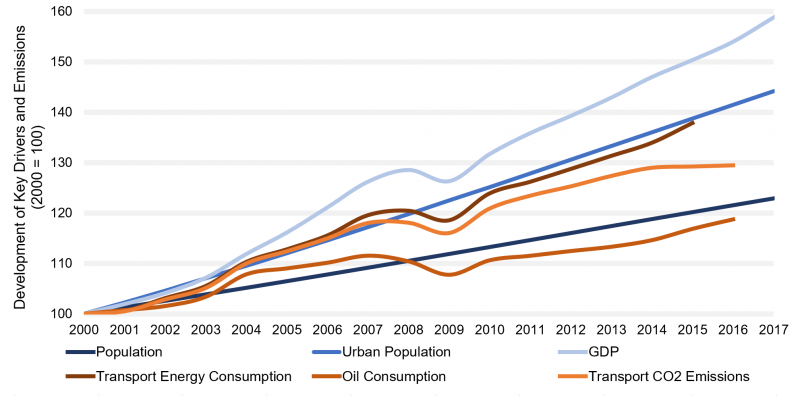
(Source: UN Stats, World Bank, IEA, EIA, EDGAR 4.3.2_FT2016)
Secondly, the TCC-GSR will illustrate transport emissions trends that create wider impacts (e.g. national/ regional growth of transport GHGs).
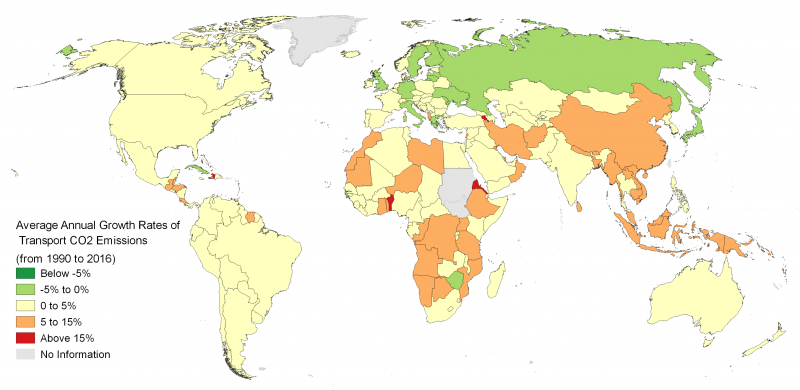
(Source: SLoCaT calculations based on EDGAR 4.3.2_FT2016)
Thirdly, the TCC-GSR will detail policy targets and measures being employed to counter rising emissions from the transport sector (e.g. different fuel economy and vehicle standards implemented worldwide).
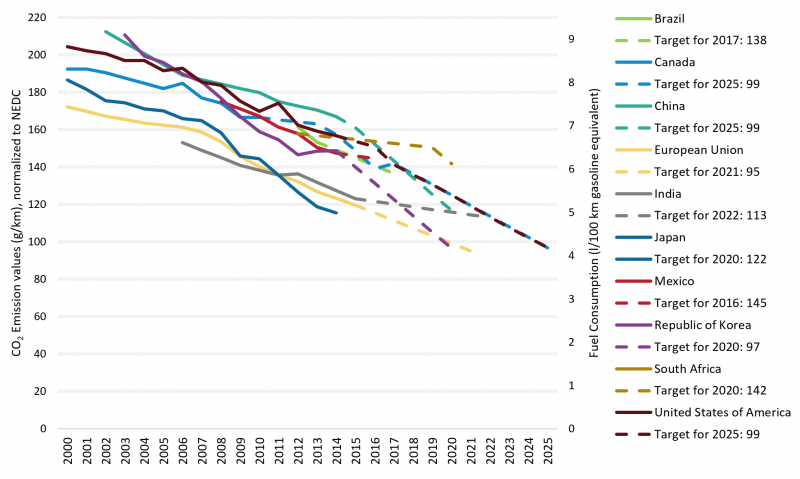
(Source: ICCT)
If you are interested to receive more information on the data output and infographics of the TCC-GSR, please contact Nikola Medimorec at nikola.medimorec@slocatpartnership.org.
| The TCC-GSR 2018 was primarily supported by these organisations: | |
|
|
|
|
|
|


Back to the TCC-GSR homepage[/vc_column_text][/vc_column][/vc_row]